Our unsettled climate future
All statements by climate science about the future depend on computer models. But how good are they really?
Lesen Sie die deutsche Version hier.
Human influences on the climate are physically small – they shift the planet’s energy flows by only about 1 percent. That doesn’t mean we can ignore them, because the climate system is sensitive. But it does exacerbate the challenge of understanding what future climates will be.
Computer modeling is central to that task. The models help us understand how the climate system works, why it has changed in the past, and – most importantly – how it might change in the future under natural and growing human influences. But fundamental circumstances limit the models’ ability to usefully describe the earth’s climate. To understand why, we must dig a bit into the details.
All but the simplest computer models of the climate begin by covering the earth’s land surface with a grid of squares, typically 100 km on a side. To describe the atmosphere, 10-20 layers of grid boxes are stacked above those squares. With a similar, but finer, grid covering the ocean, the model comprises one million grid boxes for the atmosphere and 100 million grid boxes for the ocean.
Months of calculation by supercomputers
The computer models use the fundamental laws of physics to calculate how the air, water, and energy in each box at a given time move to neighboring grid boxes at a slightly later time; this time step can be as small as 10 minutes. Repeating this process millions of times simulates the climate for centuries, a calculation that can take months of computer time on even the most powerful supercomputers. Comparing the results of computer runs with what we know about past climates gives some sense of how good a model is. Calculations into the future under assumed human and natural influences then purport to describe the climate decades hence.
Unfortunately, while all this might sound straightforward, it isn’t. A major problem is that many important phenomena are much smaller than the 100 km grid size. For example, flows of sunlight and heat through the atmosphere are influenced by clouds. Because there are far too many clouds to follow each in detail, researchers must make “subgrid” assumptions about the number and type of clouds in each grid box to build a complete model. Cloud cover is only one among dozens of subgrid assumptions. Another is How much snow or ice is on the surface?, which controls the heating effect of sunlight.
Each subgrid assumption has numerical parameters that must be set, somehow. Modelers determine subgrid parameters based on what they know about physics and weather and climate observations and then run the model. Since the results generally don’t much look like the climate system we observe, modelers adjust (“tune”) these parameters to better match some features of the real climate system. Different modelers will make different assumptions with different tunings and so produce widely different results.
Tuning is a necessary, but perilous, part of modeling the climate, as it is in modeling of any complex system. An ill-tuned model will be a poor description of the real world, while overtuning risks cooking the books— that is, predetermining the answer. For example, a paper1 laying out the details of one of the most esteemed models of Germany’s Max Planck Institute, tells of tuning a subgrid parameter (related to convection in the atmosphere) by a factor of ten because the value chosen originally resulted in twice as much warming as had been observed. Changing a subgrid parameter by a factor of ten from what you thought it was – that’s really dialing the knob!
The attempt to get feedbacks right
To extract useful information from vastly different models, results are usually quoted as averages over a collection (“ensemble”) of models; the most recent UN IPCC assessments used the CMIP6 ensemble. The diversity of that ensemble is already evident in one of the simplest descriptions of the climate – the earth’s average surface temperature. It varies across the ensemble by about 3ºC, three times greater than the observed warming during the 20th century. And the models differ just as significantly when you start to look at the details of their results. For example, since you’re not allowed to tune the freezing temperature of water (as it’s determined by Nature), the amounts of snow and ice cover might be very different for models with different surface temperatures. That can be seen in the differences between the sunlight absorbed by the Northern and Southern hemispheres for the CMIP6 models.2 It is disturbing that the range is large compared both to the observed value and to current human influences.
While it would be reassuring if the models were able to accurately describe the current climate, the crucial issue for society is how well they describe the response of the climate to physically small human influences such as warming greenhouse gases, cooling aerosols, and changes in land use. Here, the most important thing that a model has to get right are “feedbacks.”
Here’s how feedbacks work. The growing greenhouse gas concentrations that raise the global temperature can also cause other changes in the climate system that either amplify or suppress their direct warming influence. For example, as the globe gets warmer, there’ll be less snow and ice on the surface, which decreases the planet’s reflectivity. The less reflective earth will then absorb more sunlight, causing even more warming. Other important feedbacks involve the amount of water vapor and clouds in the atmosphere or the temperature profile of the atmosphere. The average of results over the many different models in the ensembles suggests that the net effect of all feedbacks is to double or triple CO2’s direct warming influence.
The size, or in some cases even the sign – that is, whether they result in net warming or net cooling – of these feedback effects cannot be understood precisely enough from first principles, but must emerge from a model as it’s tuned, and each model will give somewhat different answers. For example, a common measure of how the climate system responds to human influences, and an important piece of information we hope to learn from models, is the Equilibrium Climate Sensitivity, or ECS. That’s how much the average surface temperature would increase if the CO2 concentration were doubled from its preindustrial value. If emissions continue at their current pace and the carbon cycle doesn’t change much, that doubling would happen in the real world toward the end of this century. The higher the ECS (i.e. the larger the predicted temperature increase), the more sensitive the climate to human influences (or at least to increased CO2).
The ECS values from 37 models of the CMIP6 ensemble show that about one-third of the models result in simulated climates that are more sensitive than the likely upper limit of 4.5ºC given previously by the IPCC. The most recent IPCC report mitigated that embarrassment by combining the ensemble values with observations of the individual feedback processes involved to estimate that ECS is likely within the range 2.5 – 4.0 ºC.
The range of sensitivities in the model ensembles has actually grown as the models became more sophisticated – including finer grids, fancier sub-grid parametrizations, and so on. Having better tools and information to work with should make the models more accurate and more in line with each other. That this has not happened should be kept in mind when you read “Models predict …”. The fact that the spread in their results is increasing is as good evidence as any that “The Science” is far from settled.
Models do not all match
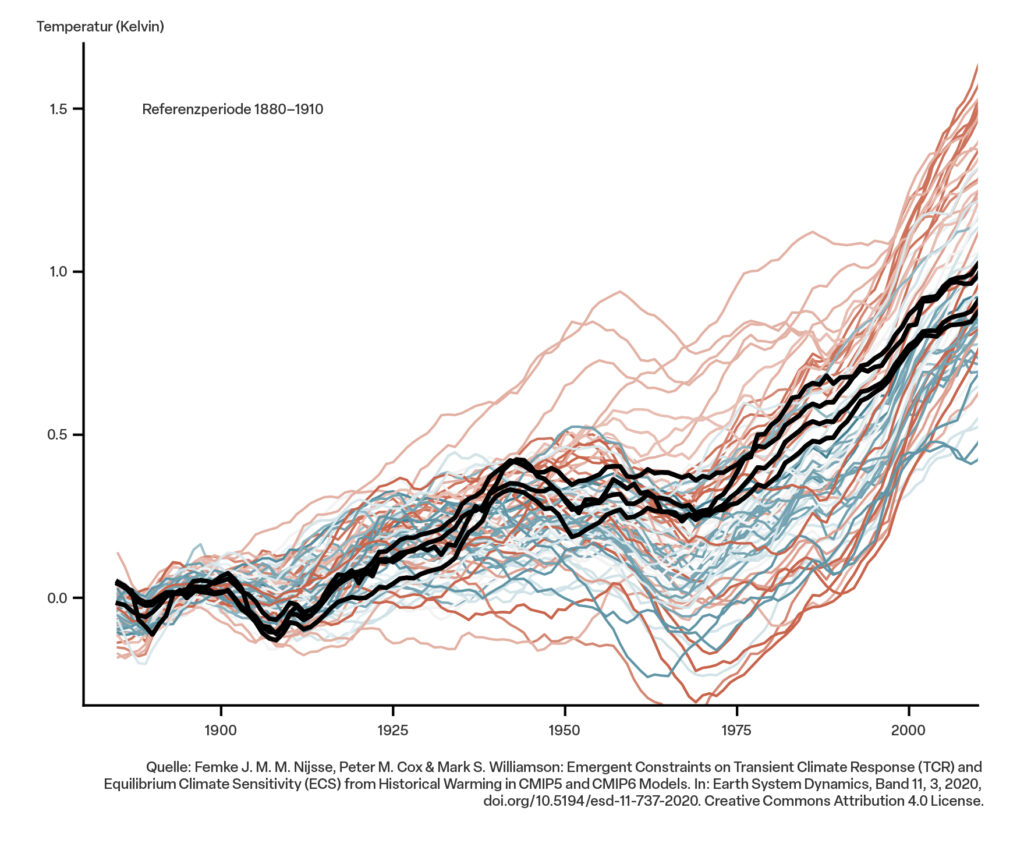
Model deficiencies are even more evident in how well they reproduce observed changes in the climate. The figure3 below shows temperature changes from 1880 to the present calculated by 34 CMIP6 models; the traces correspond to the individual models. That very few, if any, agree with the observed changes (black lines) implies errors in the model feedbacks or in the relative sensitivities to warming greenhouse gases and cooling anthropogenic aerosols or the presence of ill-described natural variability.

The popular perception is that the models all agree. But that isn’t at all the case. Comparisons among models within these ensembles show that, on the scales required to measure the climate’s response to human influences, model results differ dramatically both from each other and from observations. But you would not know that unless you read deep into the IPCC report. If you did, you would find that the results being presented are “averaging” models that disagree wildly with each other. (By the way, the discordance among the individual ensemble members is further evidence that climate models are more than “just physics.” If they weren’t, multiple models wouldn’t be necessary, as they’d all come to virtually the same conclusions.)
Projections of regional climate changes are what matter most in assessing the impacts of human influences and our ability to adapt to them. Here, at least according to leaders of the field4, our capabilities are most feeble: “… for many key applications that require regional climate model output or for assessing large-scale changes from small-scale processes, we believe that the current generation of models is not fit for purpose.” Indeed. The figures in the most recent IPCC report show that, for many countries, we can’t even determine whether future precipitation will more or less than it is today.
«The figures in the most recent IPCC report show that,
for many countries, we can’t even determine whether future precipitation will more or less than it is today.»
The best we’ve got
There’s a lot to fret about in the climate modeling business. Apart from the computational challenge of simulations that can take months to run on even the world’s fastest computers, there’s the ambiguity in tuning, ill-quantified natural variability, and complications like the trade-off between greenhouse gas warming and aerosol cooling to contend with. No wonder we’ve got a poor understanding of how the climate will respond to rising greenhouse gas concentrations. The more we learn about the climate system, the more we realize how complicated it is.
«The more we learn about the climate system, the more we realize how complicated it is.»
Climate models will become more sophisticated (finer grids, more elaborate subgrid assumptions) as computers become more powerful, but not necessarily more accurate in describing the climate response. The application of artificial intelligence methods to describe subgrid phenomena is a currently promising line of research. And what will certainly help is better observations of the climate system, particularly the subsurface ocean.
As the reports themselves always note, the models are the best we’ve got, and they are becoming more sophisticated all the time. But they’re rife with problems. I, along with everyone else, sure wish they were better.
This text was adapted from Steven E. Koonin’s book Unsettled: What climate science tells us, what it doesn’t, and why it matters, 2nd Edition, published June, 2024.
Thorsten Mauritsen, et al. «Developments in the MPI-M Earth System Model version 1.2 (MPI-ESM1.2) and its response to increasing CO2.» In: Journal of Advances in Modeling Earth Systems, 11, 998–1038; 13th of January 2019. https://doi.org/10.1029/2018MS001400. ↩
The Coupled Model Intercomparison Project (CMIP) coordinates climate model simulations worldwide as part of the World Climate Research Program (WCRP). The aim of CMIP is to better understand and predict past, present and future climate change in a multi-model context. ↩
Femke J. M. M. Nijsse, Peter M. Cox & Mark S. Williamson. «Emergent constraints on transient climate response (TCR) and equilibrium climate sensitivity (ECS) from historical warming in CMIP5 and CMIP6 models». In: Earth System Dynamics, Volume 11, 3, 2020, https://doi.org/10.5194/esd-11-737-2020. ↩
Tim Palmer & Bjorn Stevens. «The scientific challenge of understanding and estimating climate change». In: Earth, Atmospheric, and Planetary Sciences, 2nd of December 2019, https://doi.org/10.1073/pnas.1906691116. ↩


